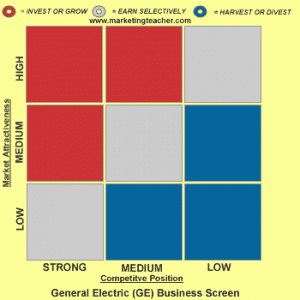
McKinsey matrix
 Management consultancies are engaged in an intensive competitive rivalry. Not wishing to be outdone by the Boston Consulting Group (BCG) and its 2×2 Boston matrix, McKinsey built upon BCG’s pioneering portfolio management work to develop a more rigorous 3×3 matrix.
The key issues and limitations of the Boston matrix are:
- Growth is only one of the factors that defines the economic attractiveness of a market.
- Market share is only one factors that defines a company’s ability to compete and generate cash from a particular market.
According to McKinsey, the economic attractiveness of a market has seven key dimensions. These are:
- Market size – the larger the market, the more attractive it is.
- Market growth – the faster a market grows, the more attractive it is.
- Competitive intensity – the lower the intensity of competition within a market, the more attractive it is.
- Market profitability – the higher the margin made by the average competitor, the more attractive the market.
- Barriers to entry – the higher the barriers to entry, the more attractive a market is
- Cyclicity – the less sensitive a market is to the economic cycle, the more attractive it is.
- Risk – the lower the risk associated with operating in a particular market, the more attractive it is i.e. Canada and Germany both compare favourably to Syria and Zimbabwe.
A company’s ability to compete effectively in and generate cash from a market has five dimensions. These are:
- Market share – the higher the market share, the greater the company’s ability to compete.
- Scale within portfolio – the more important a product or service or trade channel or geographical territory is to a company, the more time and effort it will devote to this particular part of its business operation, and thus is better equipped to compete. In contrast, tail end activities always struggle for internal attention.
- Margin % – the higher the margin from a particular activity, the greater the head space to fund investment in sales and marketing activities and thus the greater the scope to compete effectively.
- Relevant differentiation – the more differentiated a company’s offering relative to the competitive set, the greater the ability to compete subject to this differentiation being relevant and motivating to the core target market customer.
- Ability to serve – the more effective a company is at serving and satisfying its core target market customer, the greater its ability to compete.

As with the Boston matrix, the various constituent parts of a company’s portfolio are mapped onto a matrix of market attractiveness versus competitive position (i.e. ability to compete). There are then three key outcomes for each of the individual components of a company’s portfolio depending on its position on the matrix. These are:
- Invest for growth – similar to BCG’s Stars
- Maintain – similar to BCG’s Cash Cows
- Harvest or divest – similar to BCG’s Dogs
Empirical studies show that ability to compete is a much more important factor influencing value creation than market attractiveness. This means it is often much better to have a strong competitive position in a less attractive market than a weak competitive position in a fast growing market.
The challenge facing every company is to balance the need to generate cash in the near term with the need to generate cash in the future, and there is always a trade off between the two.
To discuss your business critical issue
Please call Paul New on 020 8390 9972 or 07790 501225 or send a message.


